
As part of our continuing effort to bring our readers relevant and concise market information, we have compiled and analyzed the most recent office market data for last quarter. We hope it will be a useful resource for all current or potential Denver commercial property owners, investors and operators.
The table below reports some of the key market indicators of the Class B office market, plus overall office market (Class A, B & C), for each of the 23 submarkets across the metro Denver area.
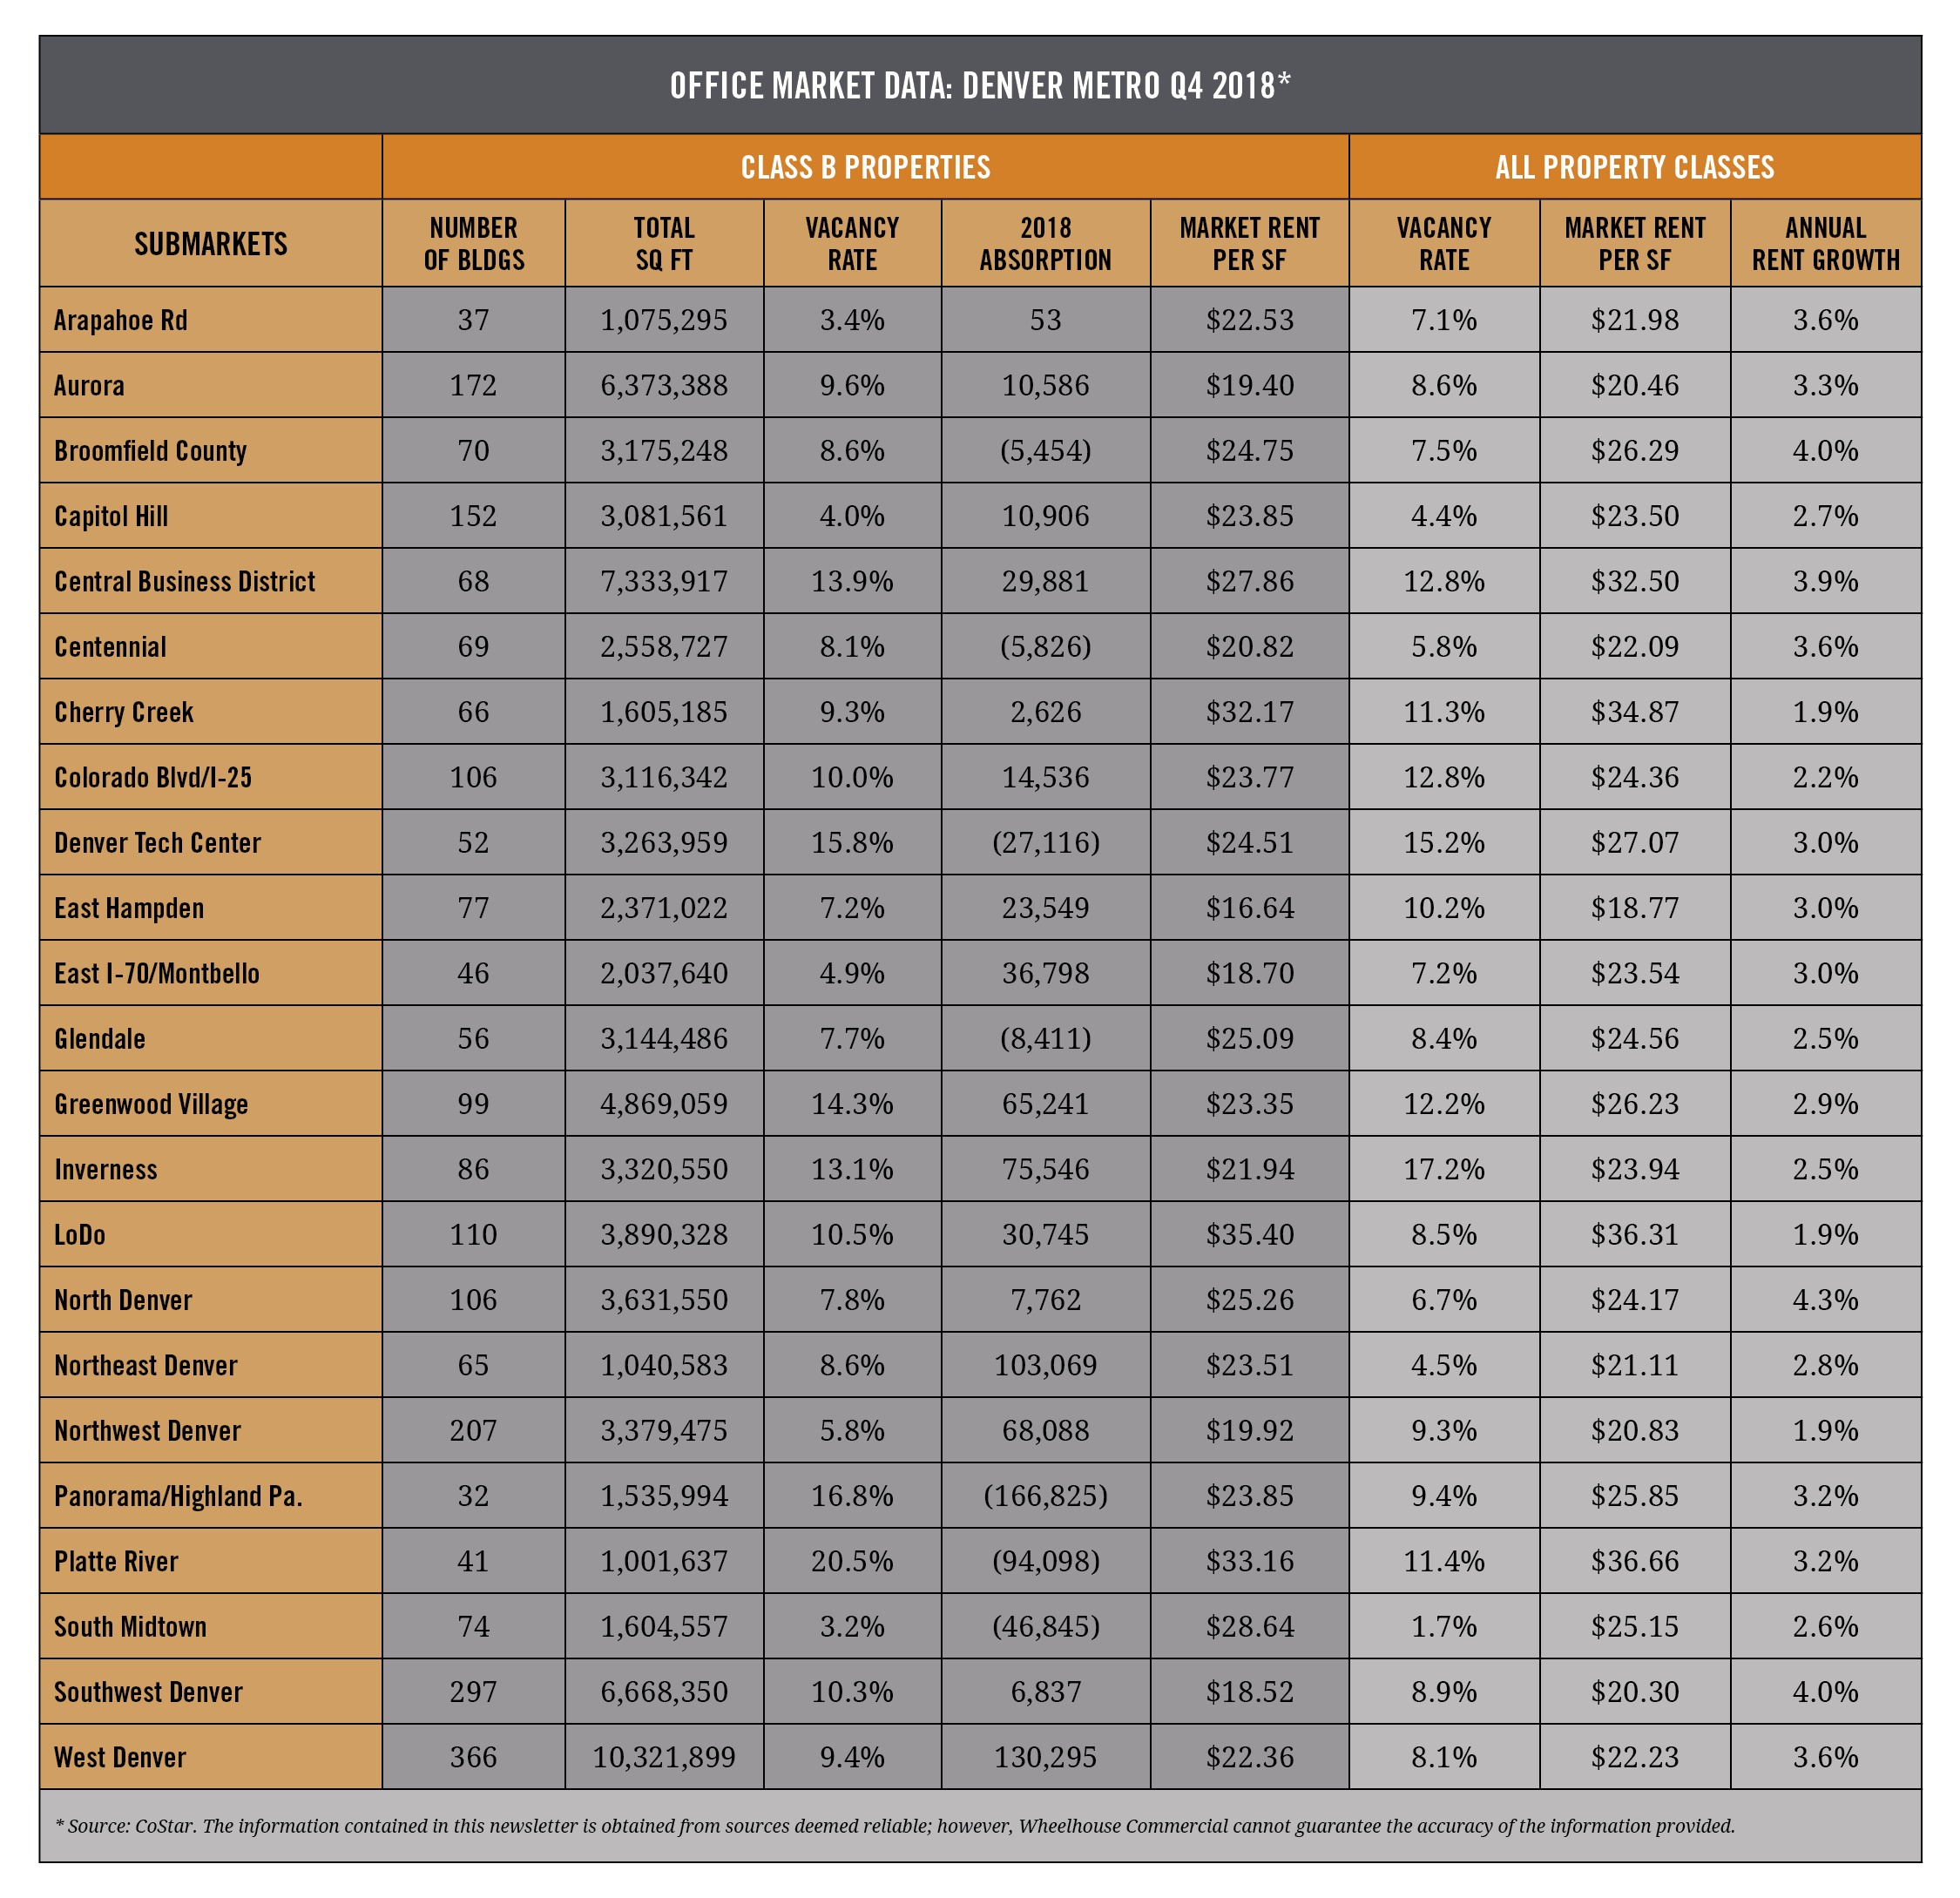
Market Rents
The metro Denver office market continues its impressive run of strong performance. In the Class B segment, market rents range from $16.64 full service gross (fsg) along the East Hampden corridor to nearly $35 fsg in the Central Business District. The asking rents for Class B buildings only lag behind the overall market rents by approximately 5%. Every submarket in the Metro area that we track (23 total) saw an overall year-over-year increase in market rents, ranging from 1.9% to 4.3%. The markets that saw the greatest rent growth were the Central Busines District (3.9%), Broomfield (4%) and North Denver (4.3%).
Vacancy
Vacancy rates for Class B buildings varied widely across the submarkets, from 3.2% in South Midtown (Golden Triangle) to 20.5% in Platte River. Many of the submarkets with higher vacancy and availability rates are the ones with significant new construction, either delivered in 2018 or currently under construction, or both. For example, the Platte River submarket has a 29.1% availability rate, however, over 1.4 million sq. ft. is currently under construction, which is 33% of the existing inventory, and nearly 1.2 million sq. ft. were delivered in the submarket last year. Until we get through this construction cycle the vacancy and availability rates will continue to fluctuate wildly; therefore, a better indicator of the health of the market is the absorption rate, which remains strong with nearly 4 million sq. ft. absorbed across the metro area in the past year.
Economy
The robust office market is being driven by a favorable local and national economy. The Denver area added 43,527 jobs from January through November 2018, an increase of 2.6%. The largest gains were in the information sector (5.7%) and professional and business services (3%), which are heavy office user segments. Unemployment sits at 3.2% for the Denver metro area and 3.3% for Colorado.*
Forecast
Due to the strong national and local economic factors, and the continued desirability of the Denver area in terms of business environment and livability, the office market has performed consistently well during the past 10 years of the recovery since the Great Recession. So, barring a sudden, severe economic downturn, the forecast is for a continuing strong office market in 2019.
* Source: US Bureau of Labor and Statistics. The information contained in this article is obtained from sources deemed reliable; however, Wheelhouse Commercial cannot guarantee the accuracy of the information provided.
 Brian Lantzy is the Vice President of Operations at Wheelhouse Commercial in Denver, Colorado. For more information about how Wheelhouse Commercial can help manage your properties, please call 303.518.7406 or email info@wheelhousecommercial.com.