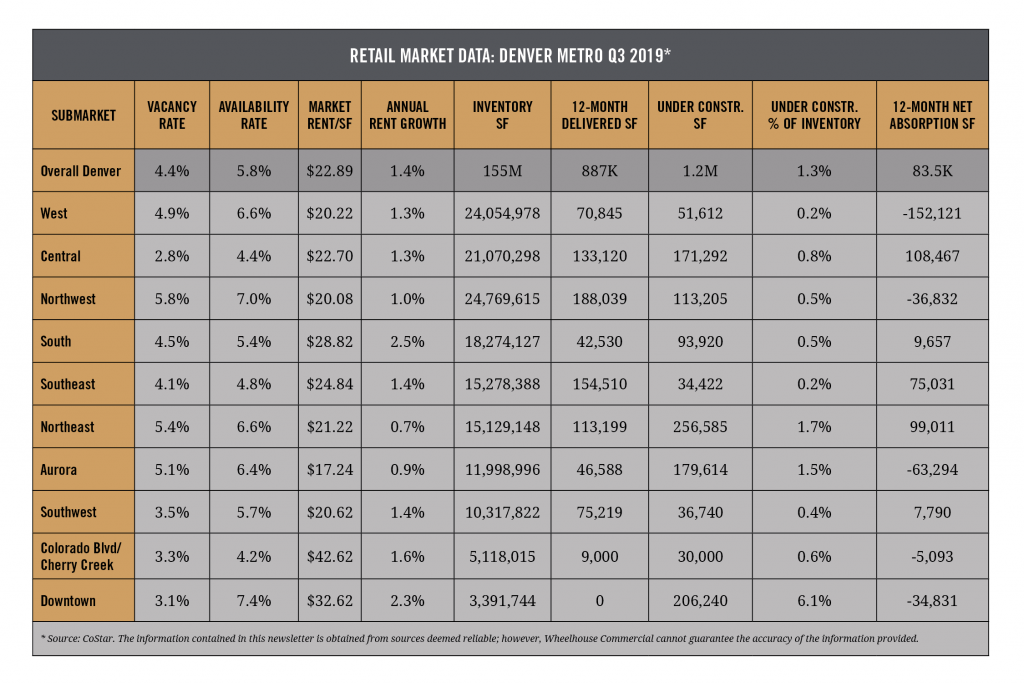
Wheelhouse Commercial has compiled and analyzed the most recent retail market data from the last quarter. The table below reports some of the key market indicators from 10 submarkets across the greater Denver retail market, during Q3 2019.
Market Rents
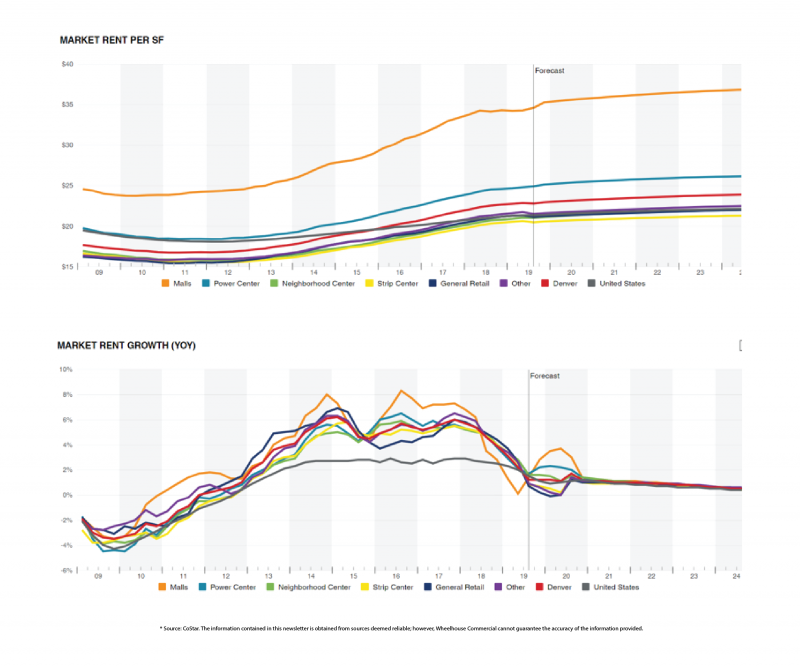
Retail rents began their steady (and sometimes dramatic) increase starting in 2012. Market rent growth was in the 5% range, year over year, consistently from 2014 to 2017. As can be seen in the two graphs below, rent growth did start to recede in 2018, but still remains slightly positive, in the 1-2% range across most product types.
The forecast is for growth to remain positive, albeit tempered for the foreseeable future. Barring a national or regional economic meltdown, the lack of new construction over this last cycle has kept the vacancy and rental rates strong, and should continue to do so.
Vacancy
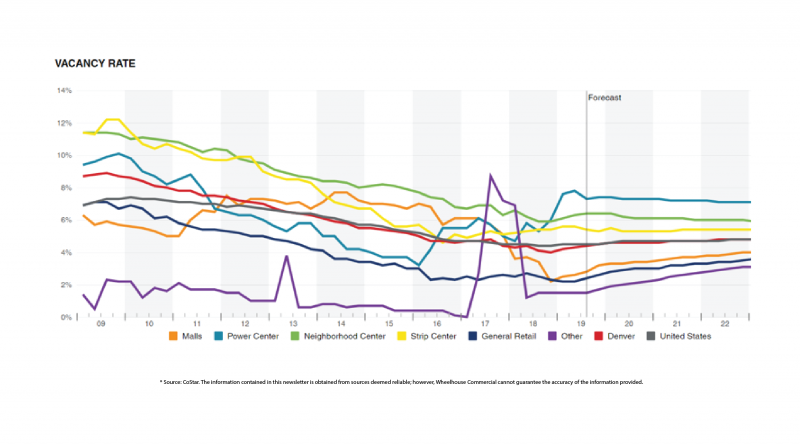
Vacancy peaked at 9% during the great recession and now remains at historically low levels of 4.4% for the overall market. The vacancy rate throughout the metro area has remained below 5% since mid-2015. Every submarket is below 6% vacant, which speaks to the vibrancy of the entire metro area, not just the high-end areas of Downtown and Cherry Creek, or the more affluent suburbs.
As with rent growth, the forecast is to now enter into a period of level-off, with vacancy rates only trending only slightly up or down, depending on the type of retail (mall, neighborhood center, strip center, etc.).
 Brian Lantzy is the Vice President of Operations at Wheelhouse Commercial in Denver, Colorado. For more information about how Wheelhouse Commercial can help manage your properties, please call 303.518.7406 or email info@wheelhousecommercial.com.